
What a Point Map Is
A point map is a CSV file of points distributed within the simulated mesh, each carrying a value mapped from a result field. Opening the export panel makes the mesh semi-translucent and shows the sample points, colored by their value.
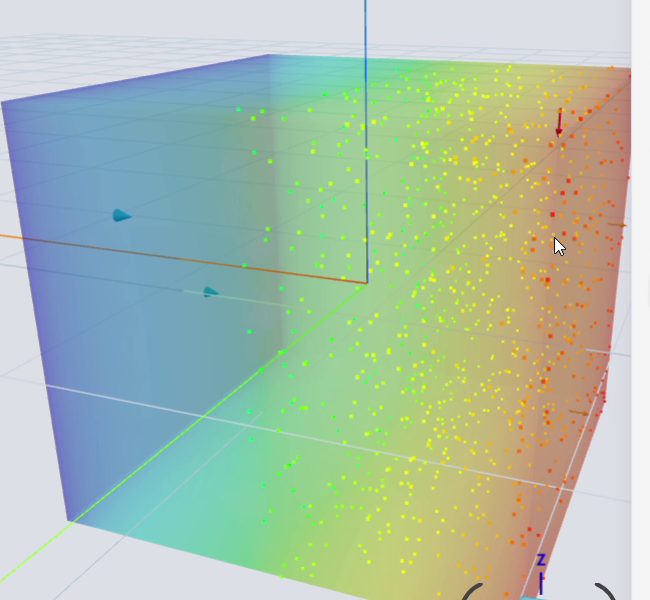
Figure 1. Sample points distributed through the semi-translucent mesh, colored by the mapped value and concentrated in the region of interest.
Set Up the Export
Click Export Point Map in the result view. In the panel:
- Filename: the name of the CSV file.
- Field: the result field the values are mapped from, for example displacement magnitude.
- Input lower and upper: the range of the result field to sample. Only regions with a target field value inside this range receive points, which lets you target an area of interest.
- Sample count: how many points to place. More points give a denser map.
- Output lower and upper: the range of values written to the points. A density map, for example, might run from 5 percent to 30 percent.
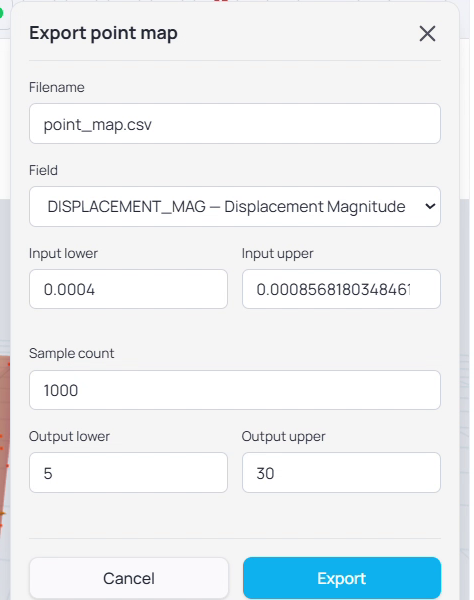
Figure 2. The Export Point Map panel: filename, field, input range, sample count, and output range.
Export and Use the File
Click Export to download the CSV. Each row is one point, with its X, Y, and Z coordinates and the mapped value. The value spans the output range you set and follows the field across the sampled region.
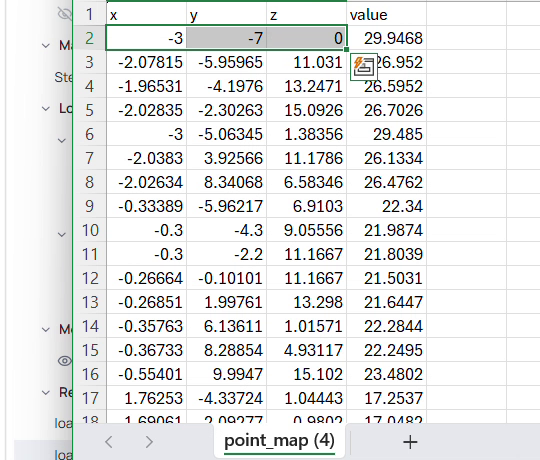
Figure 3. The exported CSV, one point per row, with X, Y, and Z coordinates and the mapped value.
This is what connects simulation back to design. A density point map from a result can guide where the infill is dense and where it is light.
Quick Reference
|
Action |
What it does |
Where to find it |
|
Export Point Map |
Opens the export panel |
Result toolbar |
|
Filename |
Names the CSV file |
Export panel |
|
Field |
The result field mapped to points |
Export panel |
|
Input lower / upper |
The result range to sample |
Export panel |
|
Sample count |
Number of points placed |
Export panel |
|
Output lower / upper |
The value range written to points |
Export panel |
|
Export |
Downloads the CSV |
Export panel |
| Previous Article | |
| sphereneNXT Simulation (Part 7): Analyzing Results |