
Open Result Analysis
In the result view, click Result Analysis. In the panel, first choose the Field to analyze: displacement, reaction, stress, or strain.
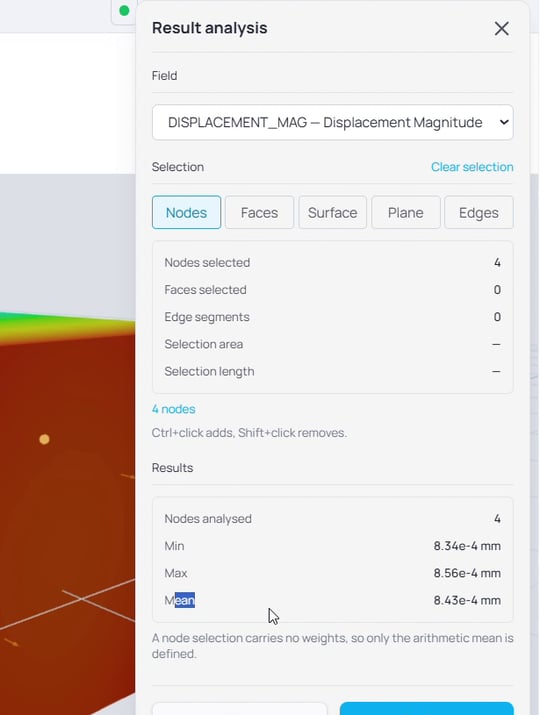
Figure 1. The Result Analysis panel: choose a field, select a region, and Analyze returns the statistics.
Select a Region
Choose where to analyze using the same selection tools as constraints and loads: Nodes, Faces, Surface, Plane, and Edges. Select on the geometry, use Add to selection to confirm, and Clear selection to start over. In the capture modes you can choose to capture nodes or a surface, and selected entities turn orange. The selection tools are covered in detail in Part 3, Constraints and Loads.
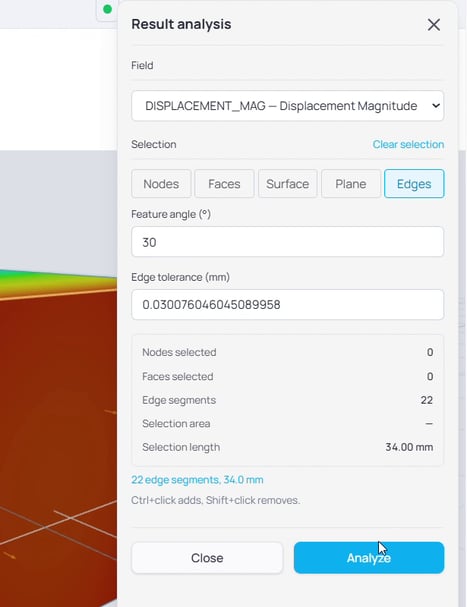
Figure 2. Edge selection, with a feature angle and the selection length that feeds the length-weighted average.
Read the Statistics
Click Analyze. You get the minimum, maximum, and average of the field over the selected region. The kind of selection adds a weighted measure:
- A node selection carries no weights, so only the arithmetic mean is defined.
- An edge selection adds a length-weighted average.
- A surface selection adds an area-weighted average.
Quick Reference
|
Action |
What it does |
Where to find it |
|
Result Analysis |
Opens the analysis panel |
Result toolbar |
|
Field |
The result field to analyze |
Analysis panel |
|
Nodes / Faces / Surface / Plane / Edges |
Select the region to analyze |
Analysis panel |
|
Add to selection |
Confirms the picked region |
Analysis panel |
|
Analyze |
Computes minimum, maximum, and average |
Analysis panel |
|
Length or area weighted average |
Added for edge or surface selections |
Analysis results |
| Previous Article | Next Article |
| sphereneNXT Simulation (Part 6): Viewing Results | sphereneNXT Simulation (Part 8): Exporting a Point Map |