
Open a Result
When the solve finishes, each load case returns a result under the Results layer. Double-click a result to view it. Each load case, and each simulation run, has its own result, so you can switch between them.
Color the Mesh by a Field
Choose the field that colors the mesh from the metric selector. You can view displacement and its components, reaction force and its components, stresses including von Mises and principal stresses, and strain.
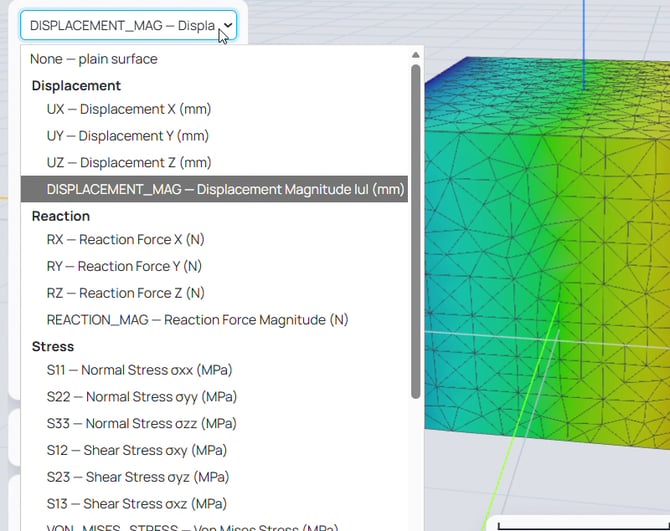
Figure 1. The metric selector lists the fields you can color by: displacement, reaction, the stresses, and strain.
The color bar shows the current range. To change it, double-click the maximum or minimum value and type a new one, and the color map updates to the new range.
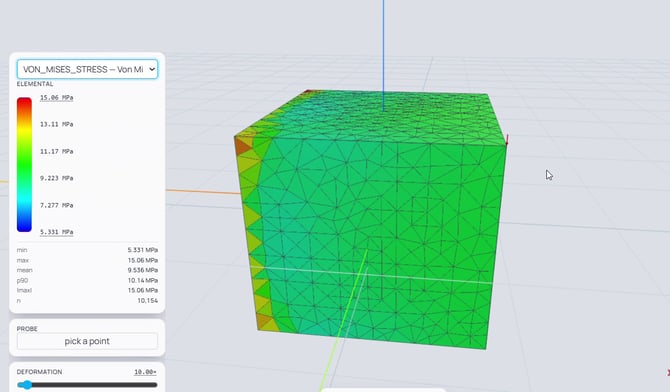
Figure 2. A von Mises stress result. The color bar and statistics sit beside the mesh, with the probe and deformation controls below.
Read the Statistics
For the field you select, the panel reports the minimum, maximum, average, 90th percentile, absolute maximum, and the number of nodes or elements.
Probe a Value at a Point
Click Pick a point, then click on the mesh to read the field value at that location. Click again to stop probing.
Animate the Deformation
The deformation controls show how the part deforms under the load with a given scaling factor. Turn on the animation checkbox to show the animation of deformation. Set the deformation scale, double-click the value to change the range of the scale bar, then move the bar to modify the scale factor. Turn off the checkbox to stop the animation.
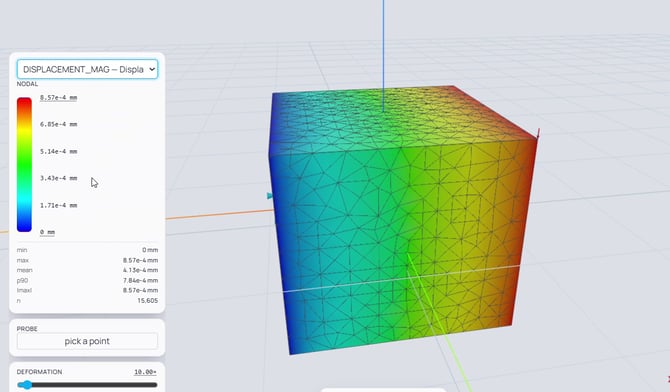
Figure 3. The same result colored by displacement magnitude, with the deformation scale and animation controls.
Quick Reference
|
Action |
What it does |
Where to find it |
|
Double-click a result |
Opens that load case or run for viewing |
Layer tree, Results |
|
Metric selector |
Colors the mesh by a field |
Result legend |
|
Color bar min / max |
Double-click to set the coloring range |
Result legend |
|
Statistics |
Min, max, average, P90, absolute max, count |
Result legend |
|
Pick a point |
Probes the field value at a location |
Result legend, Probe |
|
Deformation scale |
Scales and animates the deformed shape |
Result legend, Deformation |
| Previous Article | Next Article |
| sphereneNXT Simulation (Part 5): Solving a Study | sphereneNXT Simulation (Part 7): Analyzing Results |