
Set Up the Mesh
Click FE Mesh in the toolbar. In the Simulation Mesh panel:
- Geometry: the model to mesh.
- Mesh type: tetrahedral. Further mesh types are planned.
- Element type: linear (tet4) or quadratic (tet10).
- Max element size (mm): the target element size.
- Min element size (mm): a lower limit to preserve small features if needed, where 0 turns it off.
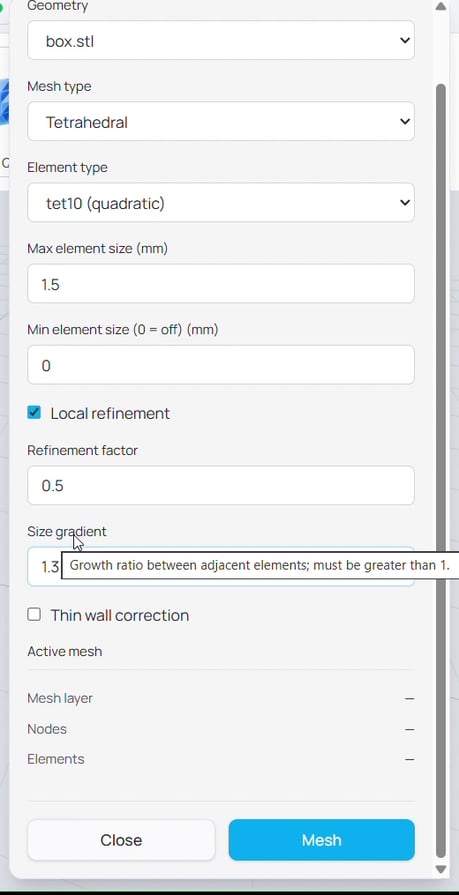
Figure 1. The Simulation Mesh panel with element type, sizes, and Local refinement set with a refinement factor and size gradient.
Refine Where It Matters
Two options let you put detail where it counts:
- Local refinement concentrates smaller elements near your constraints and loads. Refinement factor scales the element size in those regions relative to the max size, and Size gradient sets the growth ratio between neighboring elements, which must be greater than 1.
- Thin wall correction helps very thin walls survive meshing. It takes a Fidelity epsilon value, an absolute distance you set below the thinnest wall you need to preserve. It must be greater than 0 to have any effect. A recommend value is at most ¼ of the wall thickness.
Tip: A rejection will happen if the mesh element number is 10x larger after local refinement. Recommend using a relatively large refinement factor such as 0.9 to avoid explosion of mesh element number and computation overhead.
Generate the Mesh
Click Mesh. The job runs in the cloud, and you can follow its state in Jobs. When it finishes, the mesh appears in the Mesh sub-layer with its element count and a pass status, and you can view it as a wireframe. If wireframe is not shown, go to View -> wireframe to turn it on.
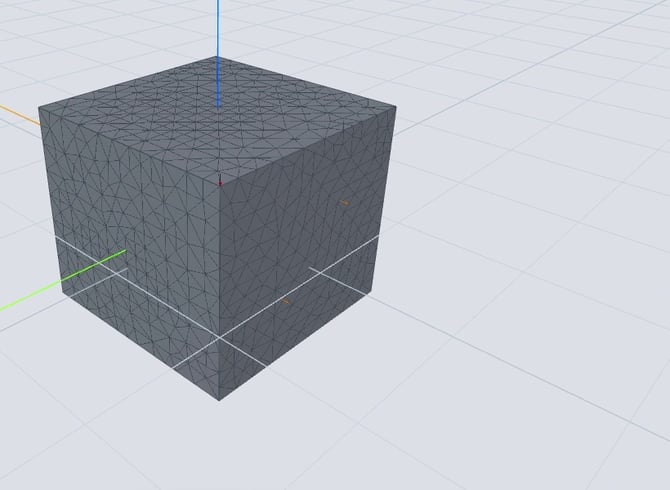
Figure 2. The generated tetrahedral mesh shown as a wireframe on the part.
Check Mesh Quality
Click Mesh Quality to inspect the result. The panel reports statistics for each metric, lets you color the mesh by a metric to see where quality varies, and shows the distribution as a histogram.
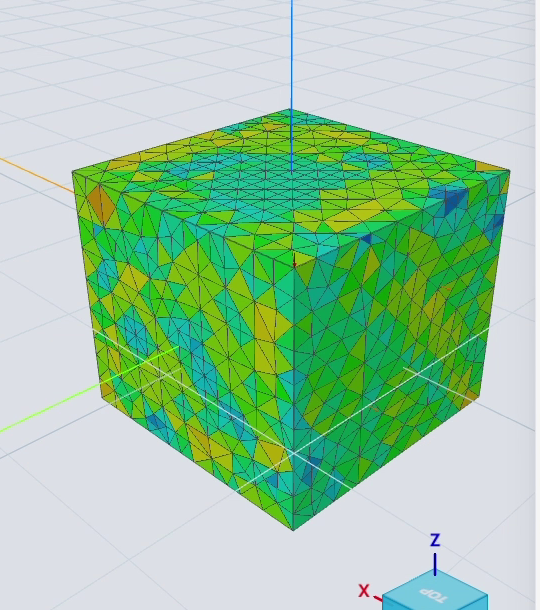
Figure 3. The mesh colored by a quality metric, revealing where element quality varies across the part.
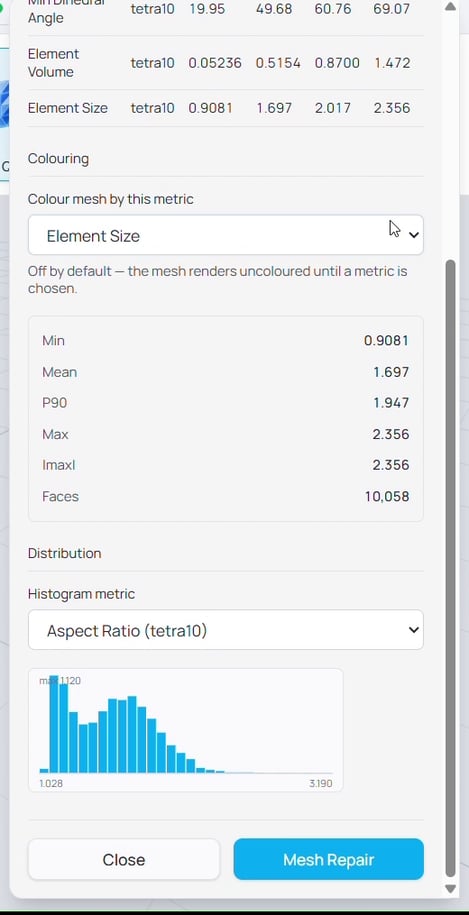
Figure 4. The Mesh Quality panel: per-metric statistics, color-by-metric, and the distribution histogram, with Mesh Repair.
A mesh that passes is ready to solve. If a metric looks poor, use Mesh Repair. If repair does not resolve it, return to the mesh settings and try a different element size, or check the input geometry for defects. If the mesh has problematic element, a checkbox next to colour mesh will show up allowing to view the problematic elements in red and all good elements in translucent.
Good to know: Mesh choices and quality drive accuracy. A good geometry with a proper meshing setup leads to better mesh quality.
Quick Reference
|
Action |
What it does |
Where to find it |
|
FE Mesh |
Opens the Simulation Mesh panel |
Toolbar |
|
Element type |
Linear or quadratic elements |
Mesh panel |
|
Max / Min element size |
Target and lower-limit element size |
Mesh panel |
|
Local refinement |
Smaller elements near constraints and loads |
Mesh panel |
|
Thin wall correction |
Helps thin walls survive meshing |
Mesh panel |
|
Mesh |
Runs the meshing job in the cloud |
Mesh panel |
|
Mesh Quality |
Statistics, color by metric, histogram |
Toolbar |
|
Mesh Repair |
Attempts to fix poor elements |
Mesh Quality panel |
| Previous Article | Next Article |
| sphereneNXT Simulation (Part 3): Constraints and Loads | sphereneNXT Simulation (Part 5): Solving a Study |